
Noise and distortion are two common head-scratching problems for engineers designing high-precision simulation systems. However, when we look at the total harmonic distortion and noise (THD+N) values in an op amp data table, it may not be immediately clear which is the enemy you are dealing with: noise or distortion?
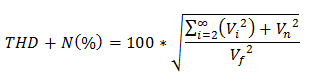
"Noise" describes the random electrical signals generated by the amplifier. "Distortion" refers to the harmful harmonics introduced by the amplifier. Harmonics are signals whose frequency is an integer multiple of the frequency of the input signal. The Total Harmonic Distortion and Noise specification quantifies these factors by comparing the level (Vi) of the distorted harmonics and the RMS noise voltage (Vn) to the level of the input signal (Vf), using the following equation:
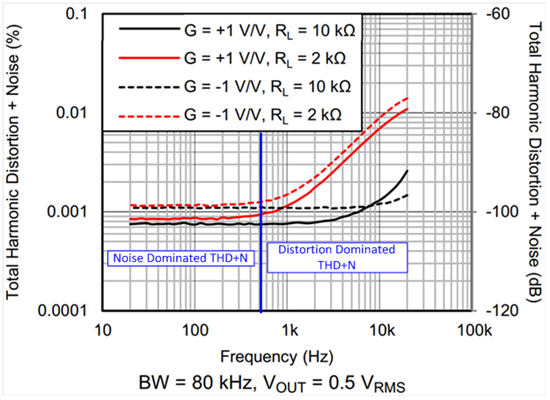
In the OPA316 data table, this curve shows THD+N measured over a frequency range for multiple configurations and output loads. Unfortunately, we can't immediately know if noise or distorted harmonics have a greater effect on THD+N. To explore this further, we can calculate the effect of noise on the measurement results.
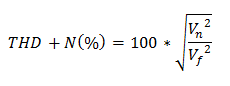
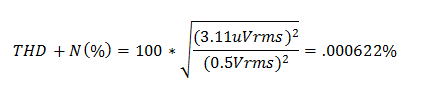
First, we simplify the THD+N calculation to remove the distortion term:
We can use the following equation to approximate the RMS noise voltage of a basic operational amplifier circuit:
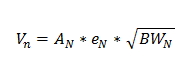
AN is the "noise gain", eN is the bandwidth voltage noise spectrum density of the op amp, and BWN is the bandwidth at which the noise is measured. Noise gain, or the increase of the amplifier to its inherent noise, is always measured on the non-inverse input of the operational amplifier. When operational amplifiers are used as non-inverse amplifiers, this method is simple and straightforward; The signal gain is the same as the noise gain. For an inverse amplifier, however, the noise gain will add 1 to the amplitude of the signal gain. For example, an inverse amplifier with a signal gain of -1 has a noise gain of +2.
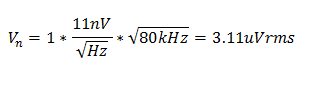
The OPA316 has a wideband input voltage noise spectral density of 11nV/√Hz, and the measurement bandwidth is rated at 80kHz. For non-inverse amplifiers (G = +1), the RMS noise voltage is approximately:
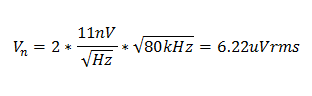
For an inverse amplifier (gain = -1), the RMS noise voltage is:
You can now use the output amplitude information given in the following figure to calculate the effect of noise on THD+N measurements in both configurations:
Non-reverse (G = +1) :
Reverse (G = -1) :
Note that these calculated values correspond closely to THD+N measured at low frequencies (<500Hz). Here, the measured value is almost entirely determined by the noise of the op amp. Since the frequency of the input signal does not affect the noise voltage, the THD+N measurement at the noise dominant frequency is flat.
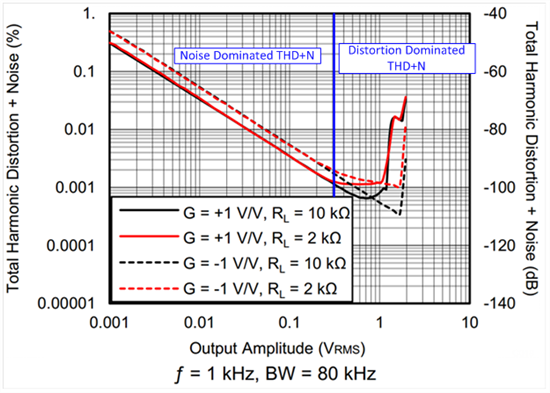
Similarly, at low signal amplitudes, THD+N measurements are mainly affected by noise. Figure 2 shows the relationship between THD+N measured on the OPA316 at 1kHz and the output amplitude. Below 300mV, the two output curves have a constant slope. RMS noise is constant and independent of the input signal amplitude, so an increase in the signal amplitude will improve the THD+N measurement. For example, in the noise-dominated region of the curve, doubling the output amplitude will halve the value of THD+N.
Circuit design for low noise has the harmful consequence of increasing noise. Non-reverse operational amps with low-value feedback resistors can provide particularly low noise, but the additional load and common-mode voltage can increase high-frequency distortion. Knowing whether noise or distortion will limit your system's performance is critical to finding an engineering solution. With some basic hand calculations and the ability to read a data sheet THD+N graph, you can quickly determine who is to blame.
免责声明: 本文章转自其它平台,并不代表本站观点及立场。若有侵权或异议,请联系我们删除。谢谢! Disclaimer: This article is reproduced from other platforms and does not represent the views or positions of this website. If there is any infringement or objection, please contact us to delete it. thank you! |

WeChat Official Account

WeChat Service
 Email
Email QQ
QQ 13823761625
