
For a long time, the power supply rejection ratio (PSRR) has been an excellent way to evaluate whether an amplifier can suppress output noise. However, with the popularity and performance advantages of Class D amplifiers, PSRR as an indicator of power supply noise suppression has become insufficient. This is especially true when comparing PSRR specifications for open-loop, closed-loop digital input I2S amplifiers. The PSRR specifications are mostly the same, but differences in sound quality are noticeable when listening to amplifiers with a non-ideal power supply. This article provides an overview of the traditional PSRR measurement method, shows how this measurement method cannot accurately determine the supply suppression performance of a Class D amplifier in a bridge load (BTL) configuration, and provides an alternative method for effectively measuring the supply noise effect in a Class D amplifier.
To understand why PSRR measurements can no longer accurately identify power supply rejection performance, it is necessary to look back to the period when Class AB amplifiers dominated consumer audio electronics. Class AB amplifiers used to be configured in single-ended (SE) or BTL output configurations, which are the same as today's configurations. In fact, Class SE and AB amplifiers generally use a split rail supply (i.e. +/ -12V), because the power supply is mainly in the form of a transformer, and adding a second rail is not a cost burden. The BTL configuration is more commonly used in audio systems with non-branch rail power supplies. However, regardless of SE or BTL configuration, Class AB amplifiers can achieve good PSRR through the basic architecture of the Class AB amplifier and the output voltage below the supply rail voltage.
For Class AB amplifiers, PSRR measurements provide a more accurate indication of the amplifier's ability to suppress power supply noise, especially for SE configurations (see below). Let's first look at the impact of Class D amplifiers on the market. The efficient operation of Class D amplifiers has changed the ecology of the market, leading to a large number of innovations in industrial design, especially the reduction of size. However, the architecture of this class of amplifiers is fundamentally different from that of Class AB amplifiers and almost uniformly uses BTL as its output configuration.
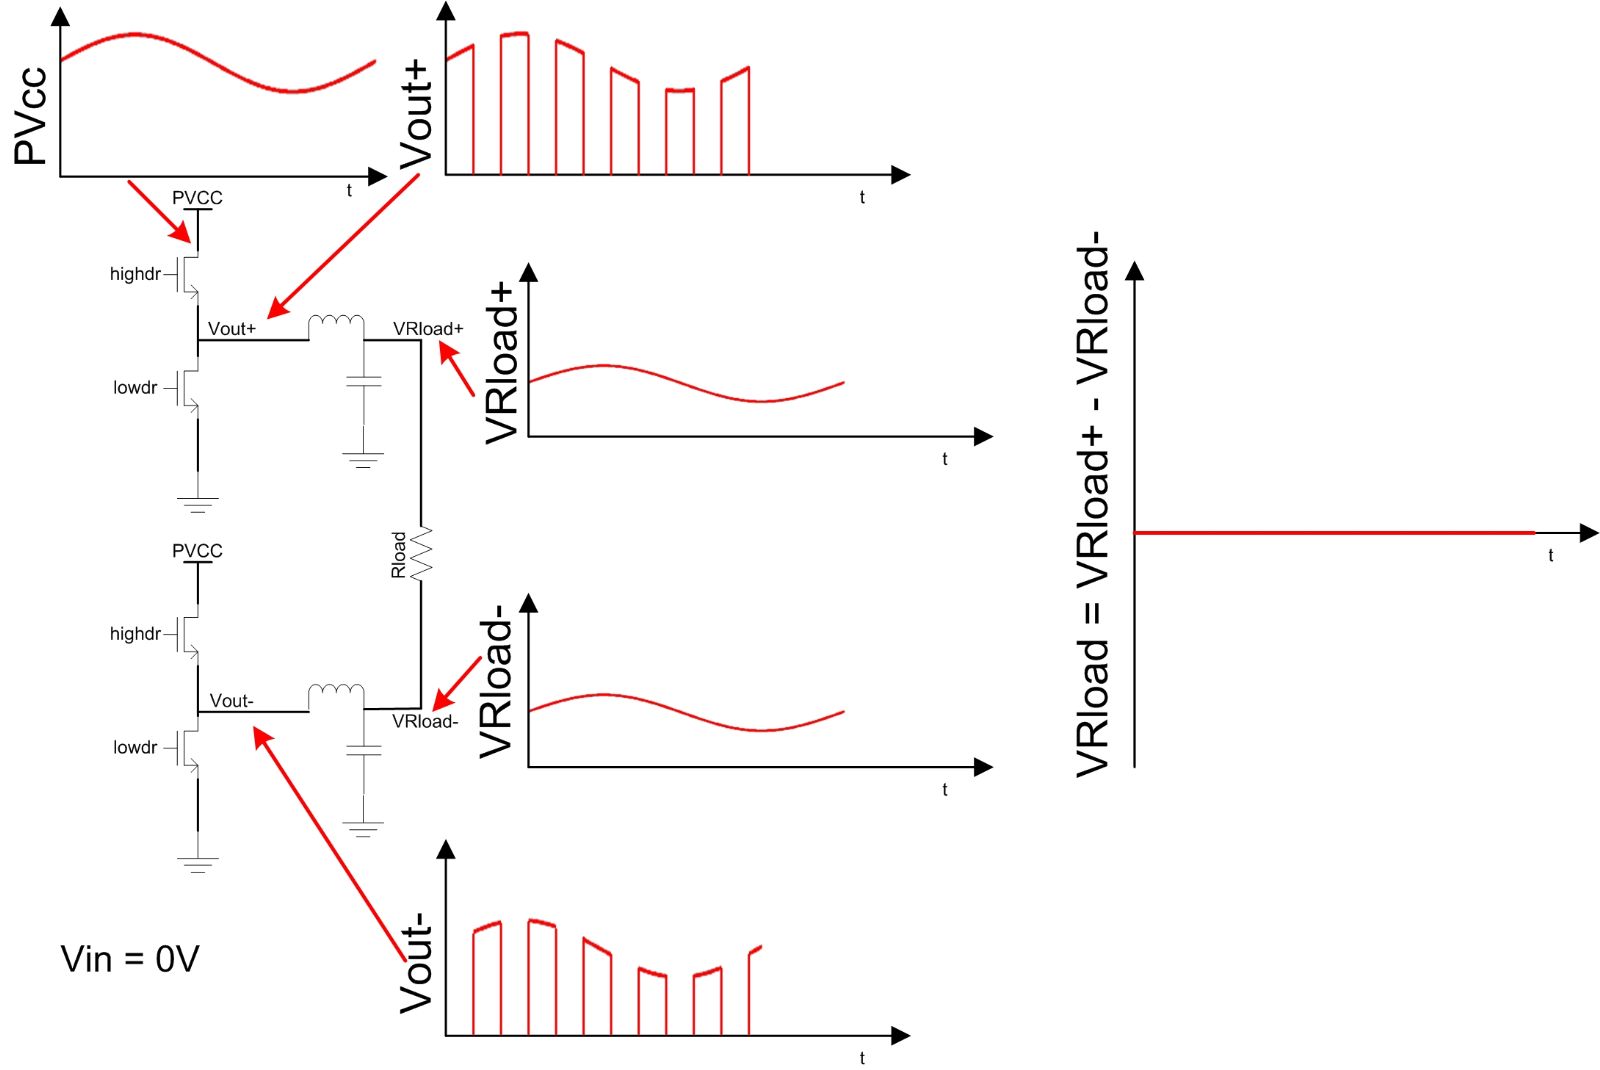
In a BTL configuration, the Class D amplifier has two output stages (also known as full-bridge) consisting of four FETS. SE Class D amplifiers have only a single output stage consisting of two FETS (also known as half-bridge). The BTL output configuration offers several advantages over the SE configuration, including four times the output power of a specific power rail, better bass response, and excellent switching noise suppression. The disadvantage of the BTL architecture is that twice the number of FET transistors are required, which means that the grain size and associated costs increase, and the cost of the reconstruction filter (LC filter) doubles. In today's SE and BTL Class D amplifier parallel market, BTL accounts for the vast majority.
In a Class D BTL configuration, traditional PSRR measurements are not effective. To understand why, it is important to understand how the Class D amplifier operates and how the PSRR is measured. Class D amplifiers are switching amplifiers in which the output switches between rails at a very high frequency, generally above 250kHz. The audio is used to perform pulse-width modulation (PWM) at the switching frequency (square wave), and then a reconstruction filter (LC filter) is used to capture the audio at the carrier frequency. The performance of this switching architecture is quite high (the architecture is the same as the switched mode power supply), but it is also much more sensitive to power supply noise than traditional Class AB amplifiers. On second thought, the output of the amplifier is basically a power rail (modulated by the pulse width), so any supply noise that occurs is transmitted directly to the output of the amplifier.
Power supply rejection ratio (PSRR) is a measure of how well an amplifier can suppress power supply noise (i.e., ripple). This is an important parameter to consider when selecting, as audio amplifiers with poor PSRR usually require a high cost power supply and/or large decoupling capacitors. In the consumer market, the cost, size and weight of power supplies are important design considerations, especially as the size of the supply continues to shrink, the price drops rapidly, and portable designs become increasingly common.
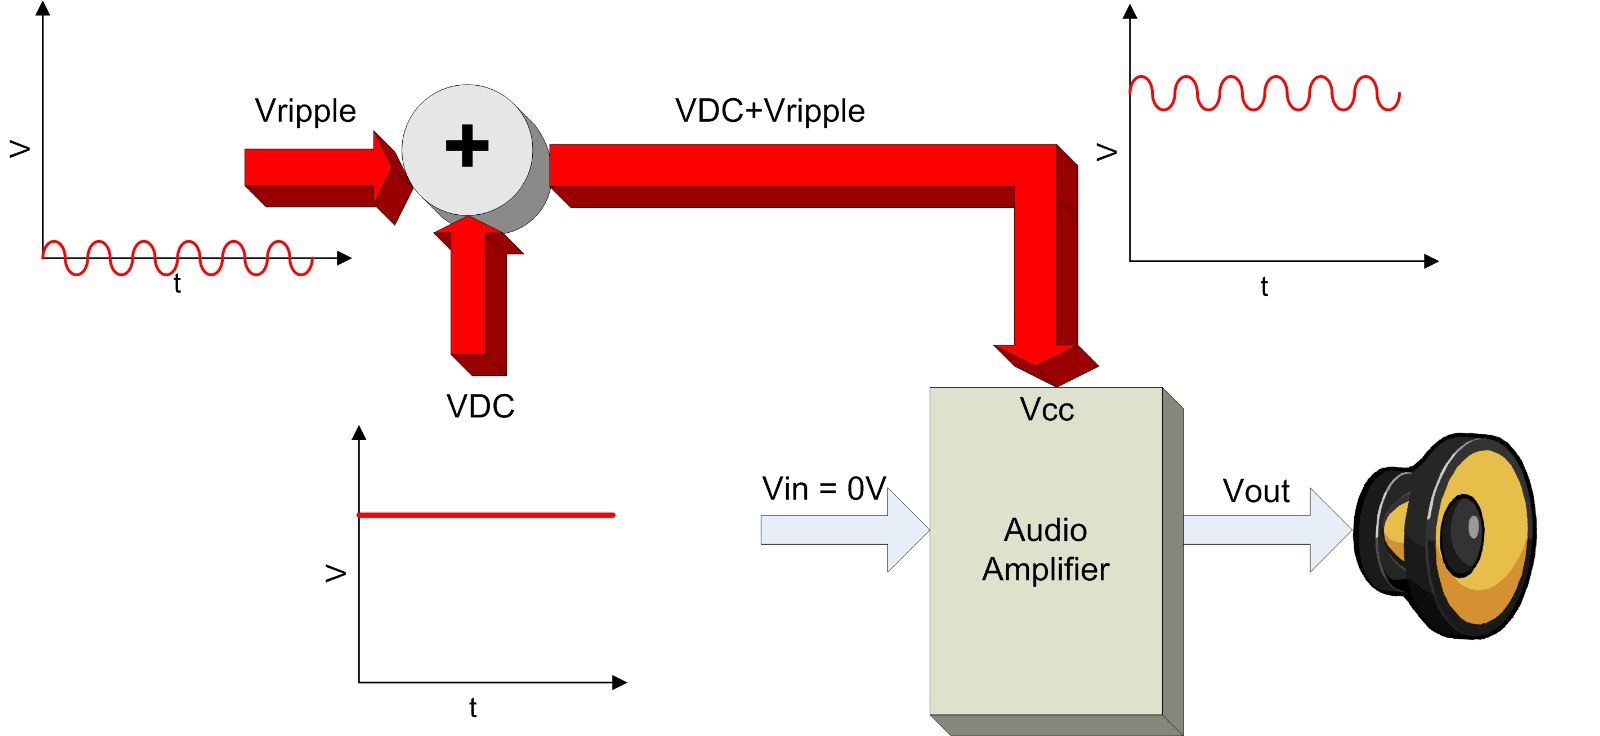
In traditional PSRR measurements, the power supply voltage of the amplifier consists of DC voltage and AC ripple signal (Vripple). The audio output is AC grounded, so there will be no audio during the measurement. Since all supply voltage decoupling capacitors are removed, Vripple does not weaken significantly (Figure 1). The output signal is then measured and the PSRR is calculated using Formula 1:
When the audio is played, the power supply noise will be mixed/modulated with the internal audio, and the entire audio band will produce varying degrees of distortion, and the BTL configuration itself can no longer eliminate the noise, which is called intermodulation distortion (IMD) in the industry. IMD is the result of mixing signals of more than two different frequencies, and in general, the resulting signal frequency will not be the harmonic frequency of one of the signals (integer multiples).
In today's consumer electronics market, most analog input Class D amplifiers use closed loops. However, one of the digital input I2S amplifiers has its drawbacks. The I2S amplifier connects directly to the audio processor or audio source via a digital bus, reducing costs and improving performance by eliminating unnecessary digital-to-analog conversion. However, closed-loop I2S amplifiers on the market today are not common because it is always quite difficult to set up a feedback loop to sample the PWM output and add it to the incoming I2S digital audio stream. In the analog feedback system, the analog output and the analog input are usually added together, so it is relatively simple and feasible. However, as the I2S market evolved, most I2S amplifiers took the approach of analog input amplifiers and used feedback architectures.
Obviously PSRR is not an effective way to measure supply suppression of BTL Class D amplifiers, so what should be done? Now let's go back to the term intermodulation. Designers need to measure the intermodulation distortion generated when playing audio and its corresponding THD+N configuration. Before we begin, let's review the SE architecture. In the SE architecture, whether it is Class AB, D or Z, there is no counteracting effect of the BTL architecture, because one end of the horn is connected to the amplifier and the other end is grounded. Therefore, for Class AB or Class D amplifiers, conventional PSRR measurements in the SE architecture can accurately indicate the supply noise suppression.
Some data can be obtained after the experiment, and the following series of measurements can be used to analyze and compare the power ripple IMD of open and closed loop I2S amplifiers. A digital 1kHz tone is injected into the amplifier's input, while a 500mVpp ripple signal at 100Hz is injected into the power supply. The FFT of the differential output can be obtained through the function built into the FFT with audio accuracy, and the IMD can be observed. Figure 3. Closed loop intermodulation curve of TAS5706
Figure 4 shows the same IMD measurement, but this time with an I2S open-loop amplifier. The 900 Hz and 1.1kHz side bands are quite obvious because there is no feedback to suppress IMD.
Figure 3 shows the IMD measurement of a closed loop I2S amplifier, noting the 1 kHz input signal and the nearly non-existent sideband. The feedback loop is effectively suppressing intermodulation distortion.
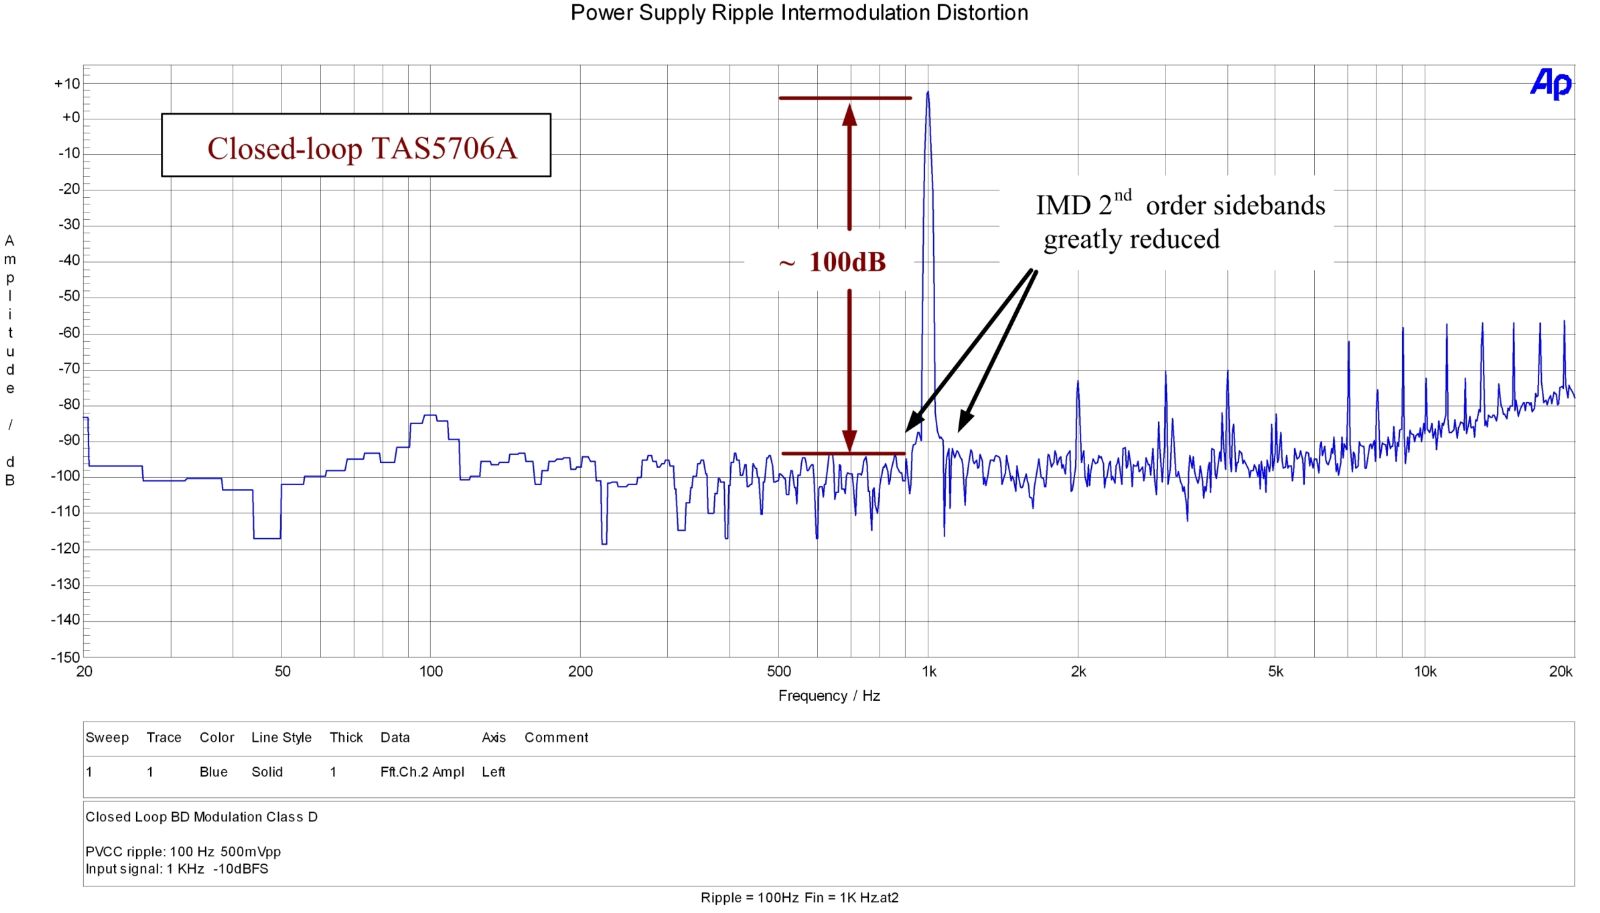
Figure 4 shows the same IMD measurement, but this time with an I2S open-loop amplifier. The 900 Hz and 1.1kHz side bands are quite obvious because there is no feedback to suppress IMD.
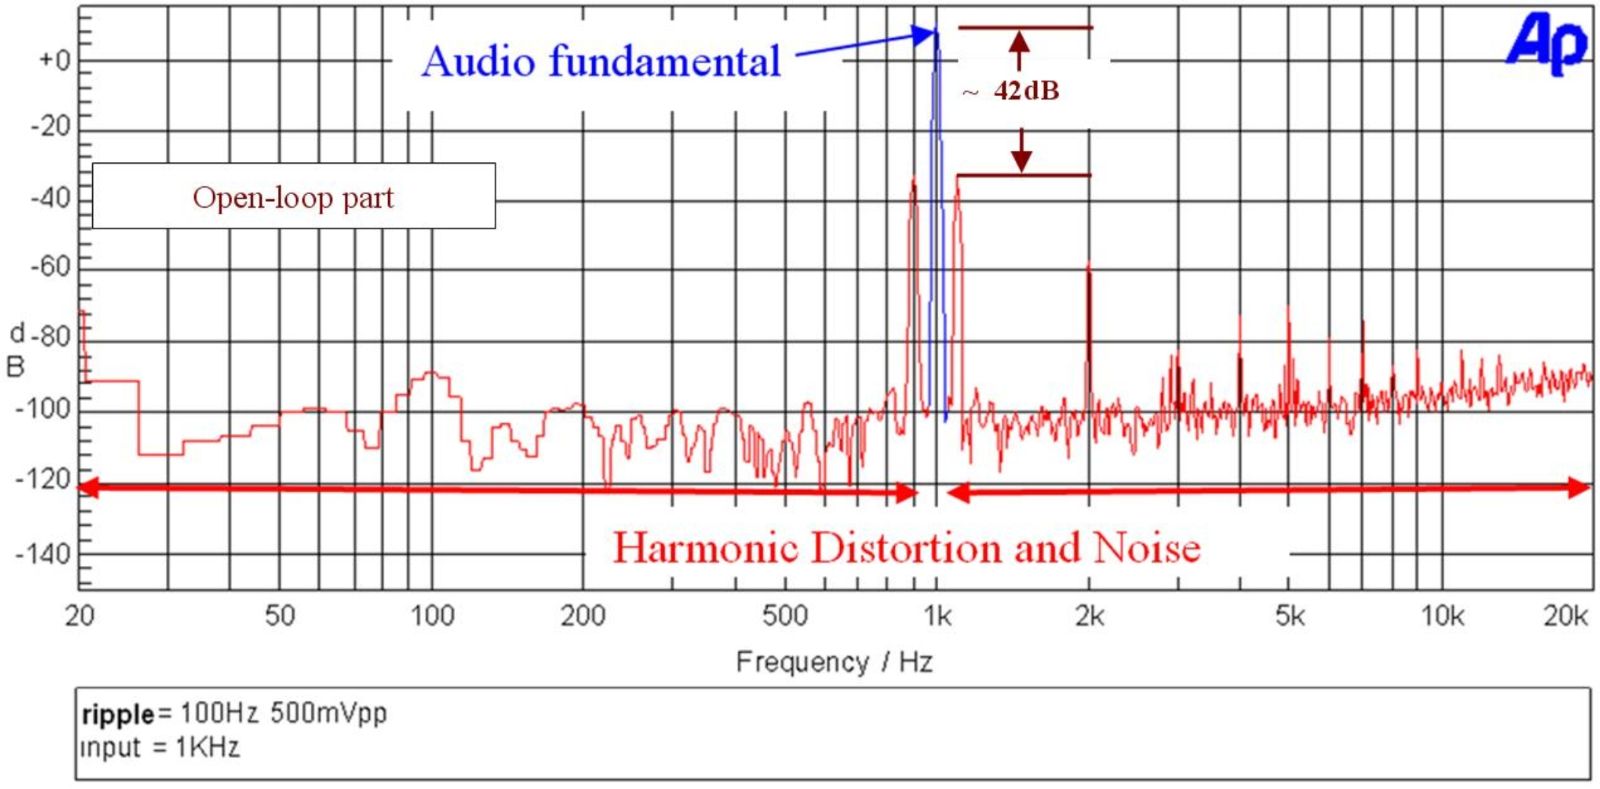
Figure 5 shows the THD+N curve of an open loop amplifier at different power ripple frequencies. Red lines indicate amplifier performance without any ripple in the power supply, which is the most desirable state. The other curve shows the ripple frequency between 50Hz and 1kHz. As the ripple frequency increases, the effect of distortion on the frequency bandwidth also increases. Good open-loop performance can be achieved with well-regulated power supplies, but this increases costs and is a
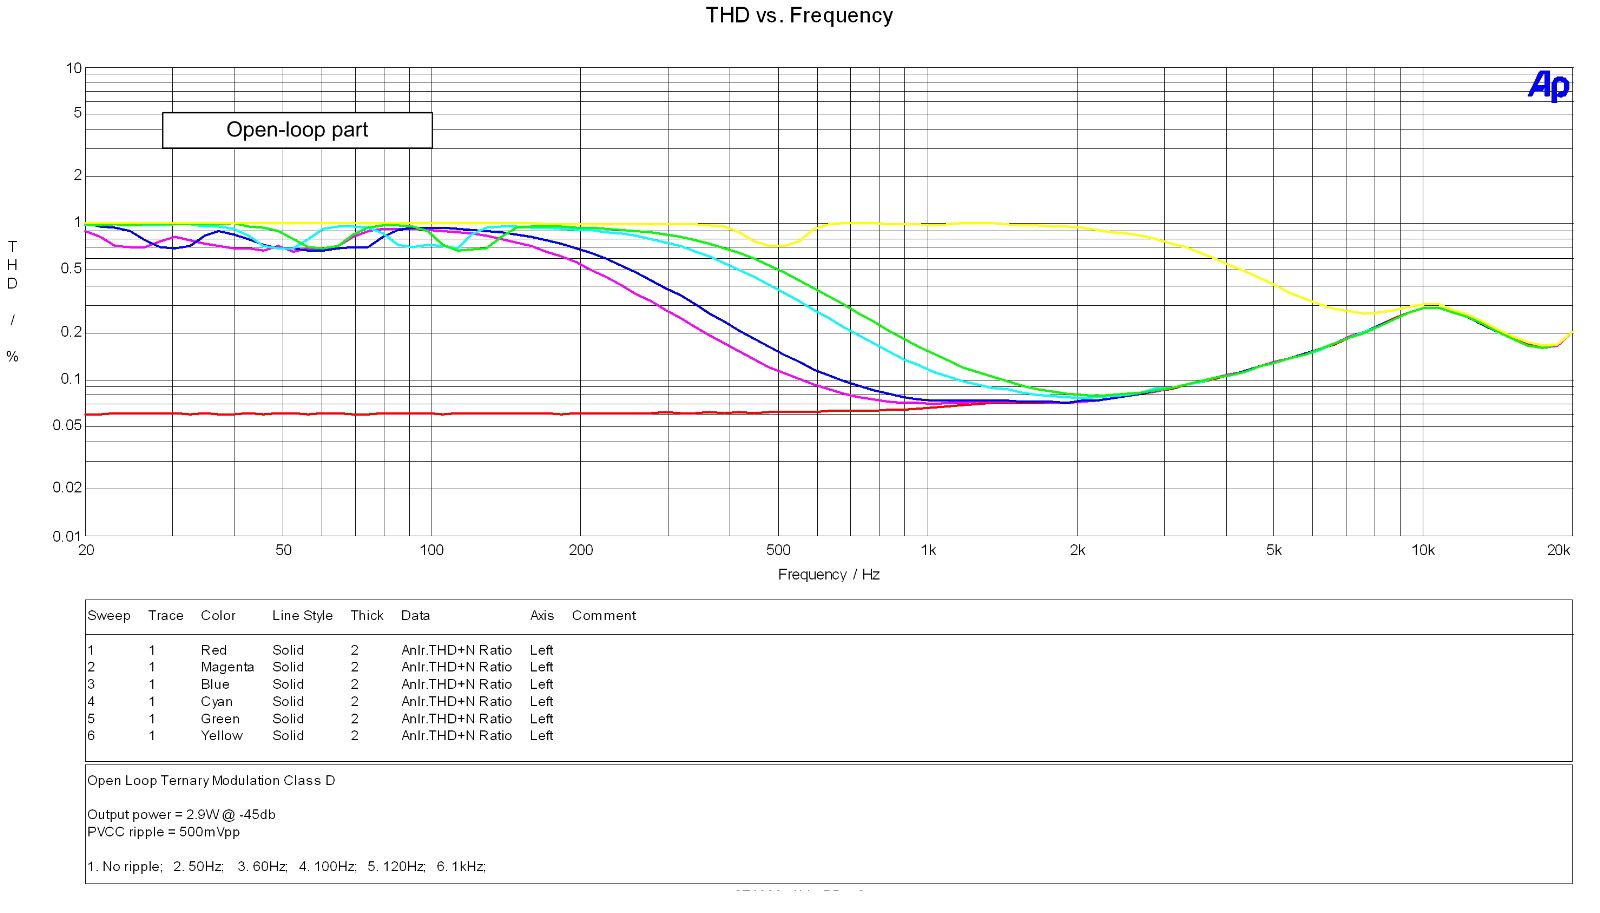
Figure 5. Open loop: THD+N and frequency at different PVCC ripple frequencies
Figure 6 shows the same THD+N curve for a closed loop amplifier. The feedback suppresses intermodulation distortion, so there is no ripple noise in the audio.
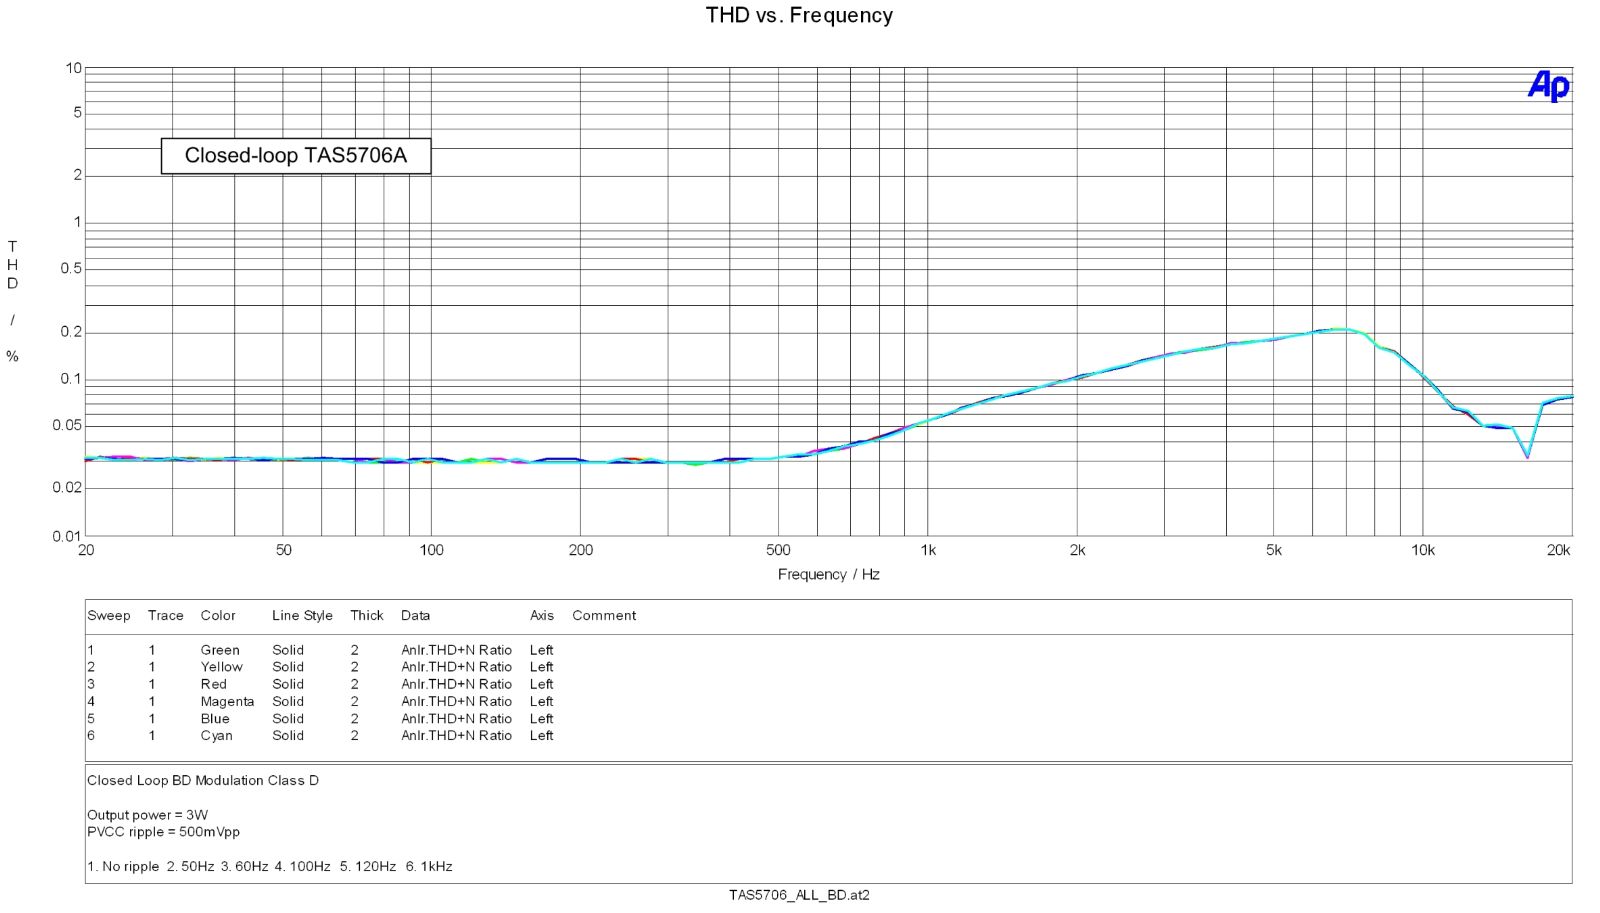
Figure 6. Closed loop: THD+N and frequency at different PVCC ripple frequencies
This paper reviews the traditional methods for measuring PSRR, and points out the reasons why they are not effective in measuring the ripple effect of BTL Class D amplifiers. The cancelling effect of the BTL output configuration itself, combined with the absence of any audio during the measurement, produced an incorrect reading. This is a major specification flaw, as the power supply noise suppression performance is one of the most important criteria when selecting a Class D amplifier, especially when looking at the performance differences between digital input (I2S) closed loop and open loop amplifiers. For a more accurate understanding of power supply noise suppression, it is necessary to check the IMD and THD+N conditions when the output has a 1kHz audio signal and the power supply is noisy. Finally, this paper explains how closed-loop Class D amplifiers can compensate for supply noise while open-loop amplifiers cannot. In the highly competitive consumer electronics market, cost is the core consideration, and whether closed loop architecture can reduce system cost is a very important design focus.
免责声明: 本文章转自其它平台,并不代表本站观点及立场。若有侵权或异议,请联系我们删除。谢谢! Disclaimer: This article is reproduced from other platforms and does not represent the views or positions of this website. If there is any infringement or objection, please contact us to delete it. thank you! |

WeChat Official Account

WeChat Service
 Email
Email QQ
QQ 13823761625
